Beyond the Speed Test: The Quality Metrics That Actually Predict Your Internet Experience
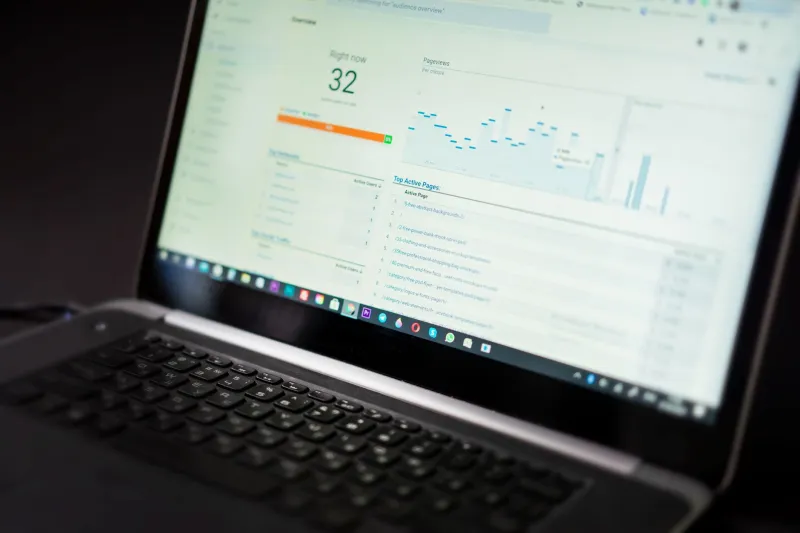
The speed test has become something of a ritual for American internet subscribers. You open a browser, navigate to a familiar testing site, watch the animated dial spin up, and either feel validated or quietly frustrated by the number that appears. But here is the uncomfortable truth: that number, the one you screenshot and send to your provider during a support call, is among the least useful indicators of your actual internet experience.
For the applications that matter most to modern households — video conferencing, cloud-based collaboration, competitive gaming, and real-time financial platforms — connection quality is determined by a set of metrics that rarely appear on a standard speed test result. Understanding what these measurements mean, and how to obtain them, is the first step toward holding your provider genuinely accountable.
Latency: The Speed of the Round Trip
Latency is the time required for a data packet to travel from your device to a remote server and return. It is measured in milliseconds and commonly displayed as a "ping" value on speed tests. Lower numbers are better. Most consumers glance at this figure and move on, but the implications run considerably deeper than a single number suggests.
For activities that require real-time interaction — a voice call, a video conference, an online game — latency is the dominant performance variable. A 200 Mbps connection with 80ms of latency will produce a noticeably worse video call experience than a 50 Mbps connection with 15ms of latency. The data arrives quickly enough in both cases; what differs is how long the system must wait for a response before sending the next packet.
Latency above 100ms becomes perceptible to most users in conversational applications. Above 150ms, the artificial pauses in a video call begin to disrupt natural speech patterns. In competitive gaming, where reaction times are measured in fractions of a second, latency above 50ms can be the difference between a functional experience and an unplayable one.
Jitter: The Inconsistency Problem
If latency measures the average delay, jitter measures the variation in that delay over time. A connection that delivers packets with consistent 20ms latency performs very differently from one that alternates between 5ms and 45ms, even though the average might be similar.
Jitter is particularly destructive for audio and video applications. Voice-over-IP systems and video conferencing platforms are engineered to receive packets at predictable intervals. When packets arrive erratically, the receiving system must either buffer incoming data — introducing artificial delay — or drop packets entirely, producing the stuttering, garbled audio that plagues so many remote meetings.
A jitter value below 5ms is generally considered excellent for voice and video applications. Values above 20ms begin to produce audible artifacts. Many standard speed tests report jitter alongside latency, though the figure is rarely emphasized in provider marketing materials or customer service conversations.
Packet Loss: When Data Simply Disappears
Packet loss occurs when data packets transmitted across a network fail to reach their destination. It is expressed as a percentage of total packets sent and is perhaps the most consequential of the three quality metrics for overall connection reliability.
Even small amounts of packet loss carry disproportionate consequences. The TCP protocol that governs most internet traffic is designed to detect and recover from lost packets, but the recovery process introduces additional latency and reduces effective throughput. A connection experiencing just 1% packet loss may exhibit effective performance far below what raw speed measurements would suggest.
For real-time applications like voice calls and live video, TCP recovery is not an option — the data is either present or absent. Even 0.5% packet loss can produce noticeable degradation in call quality. Values above 2% typically render real-time communication unreliable.
Why Providers Prefer the Mbps Conversation
The emphasis on download speed in provider marketing is not accidental. Megabits per second is a metric that providers can largely control through infrastructure provisioning, and it is a number that responds predictably to upgrades that can be sold as service tiers. Latency, jitter, and packet loss, by contrast, are influenced by network architecture decisions, peering arrangements, and infrastructure maintenance practices that are far less visible to consumers — and far less amenable to tier-based upselling.
A provider can offer a "1 Gbps plan" while maintaining network conditions that produce 40ms of jitter and intermittent packet loss. The speed tier is technically accurate. The experience is objectively poor. Without consumer awareness of what to measure and how to interpret the results, this gap between marketed capability and actual performance can persist indefinitely.
How to Measure What Actually Matters
Several tools provide access to the quality metrics that standard speed tests obscure.
Ping and traceroute utilities are available natively on Windows, macOS, and Linux. Running an extended ping — sending several hundred packets to a known server — provides both average latency and a useful approximation of packet loss. The traceroute command maps the path your data takes and can identify specific network segments where latency spikes occur.
Dedicated quality testing platforms such as Waveform's Bufferbloat Test and the Measurement Lab (M-Lab) suite provide structured assessments of latency under load — a condition known as bufferbloat that standard speed tests typically fail to capture. These tools reveal how your connection performs when it is actually being used, rather than under the artificial conditions of a single-stream speed test.
Continuous monitoring applications run in the background and log performance metrics over time, producing historical records that document whether degradation is persistent or intermittent. This type of longitudinal data is considerably more useful in a provider support escalation than a single screenshot.
Putting the Numbers to Work
Once you have established baseline measurements, comparison becomes meaningful. Document your metrics during periods of normal use and during peak hours — typically weekday evenings between 7 and 10 PM — when network congestion is most likely to manifest. Significant divergence between off-peak and peak performance is a reliable indicator of capacity limitations that your provider may be underinvesting in resolving.
Bring specific numbers to customer service interactions. A complaint about a "slow connection" invites generic responses. A documented record of 35ms average jitter and 1.2% packet loss during peak hours is a specific, measurable problem that is considerably harder to dismiss. In an environment where broadband accountability is receiving increasing regulatory attention, providers are gradually becoming more responsive to technically grounded customer concerns.
Speed, in the end, is only one dimension of connectivity. The quality of your digital experience — whether your calls are clear, your games are responsive, and your work applications perform reliably — is determined by the metrics that most providers would prefer remained invisible.